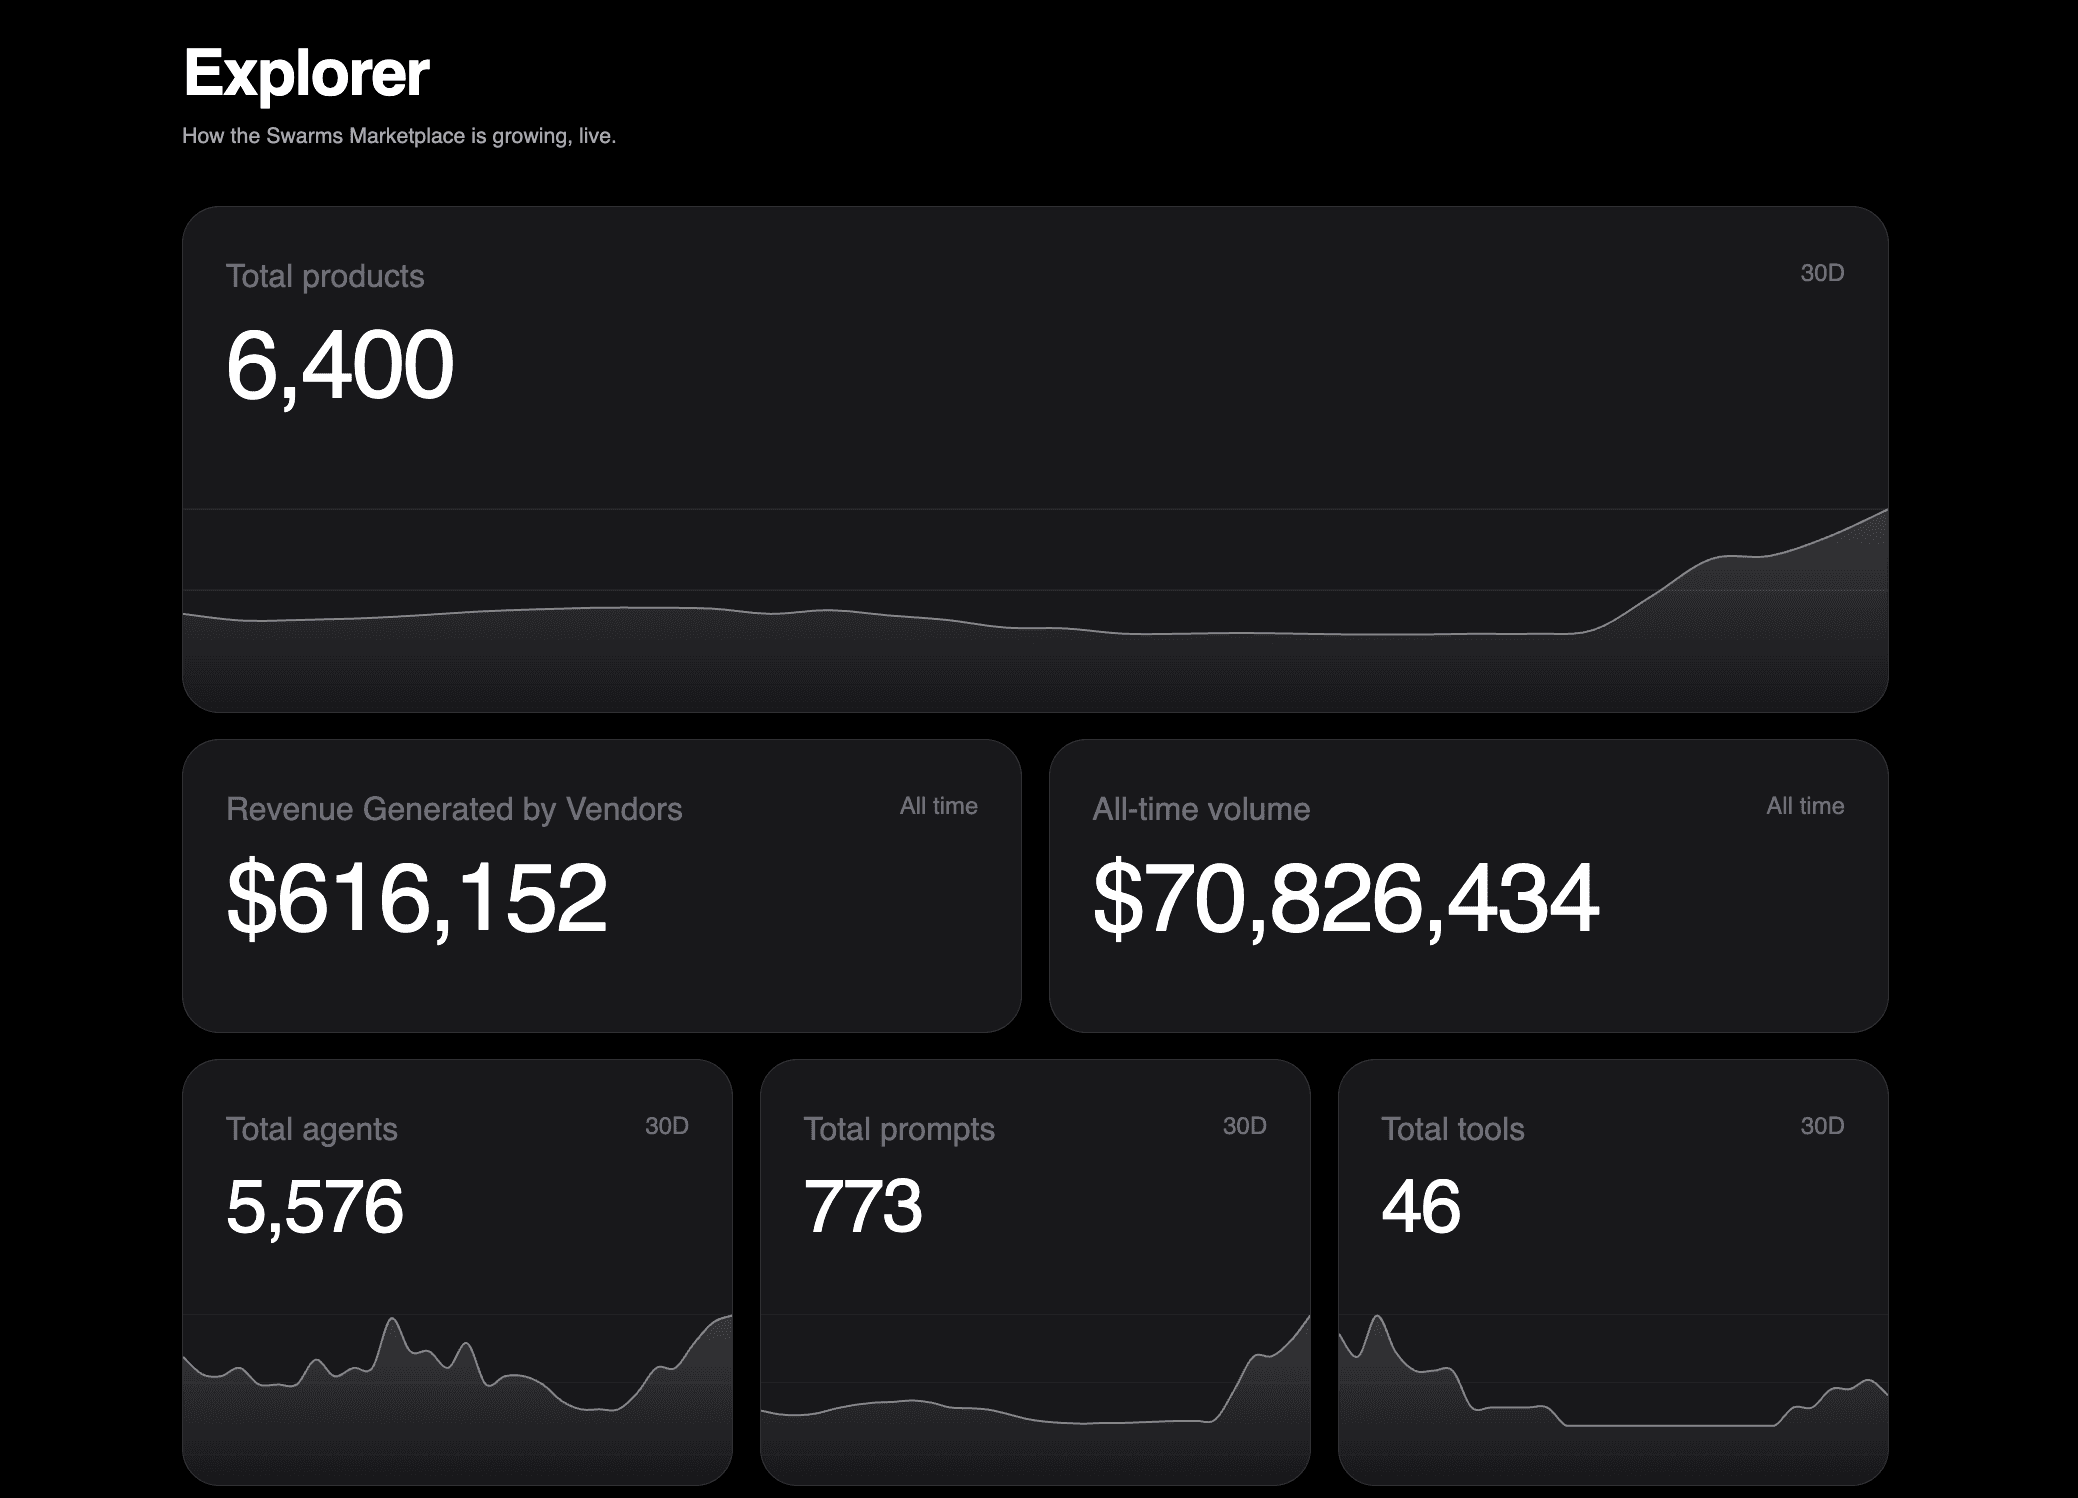
Today we are releasing the Explorer, a new page on the Swarms Marketplace that shows how the marketplace is growing, live. It puts every headline number in one place: how many products are listed, how many people are selling them, how many launched today, and how much the tokens launched on the marketplace have earned and traded.
The page updates itself while it is open. Leave it in a tab and you can watch the counts tick up as builders publish.
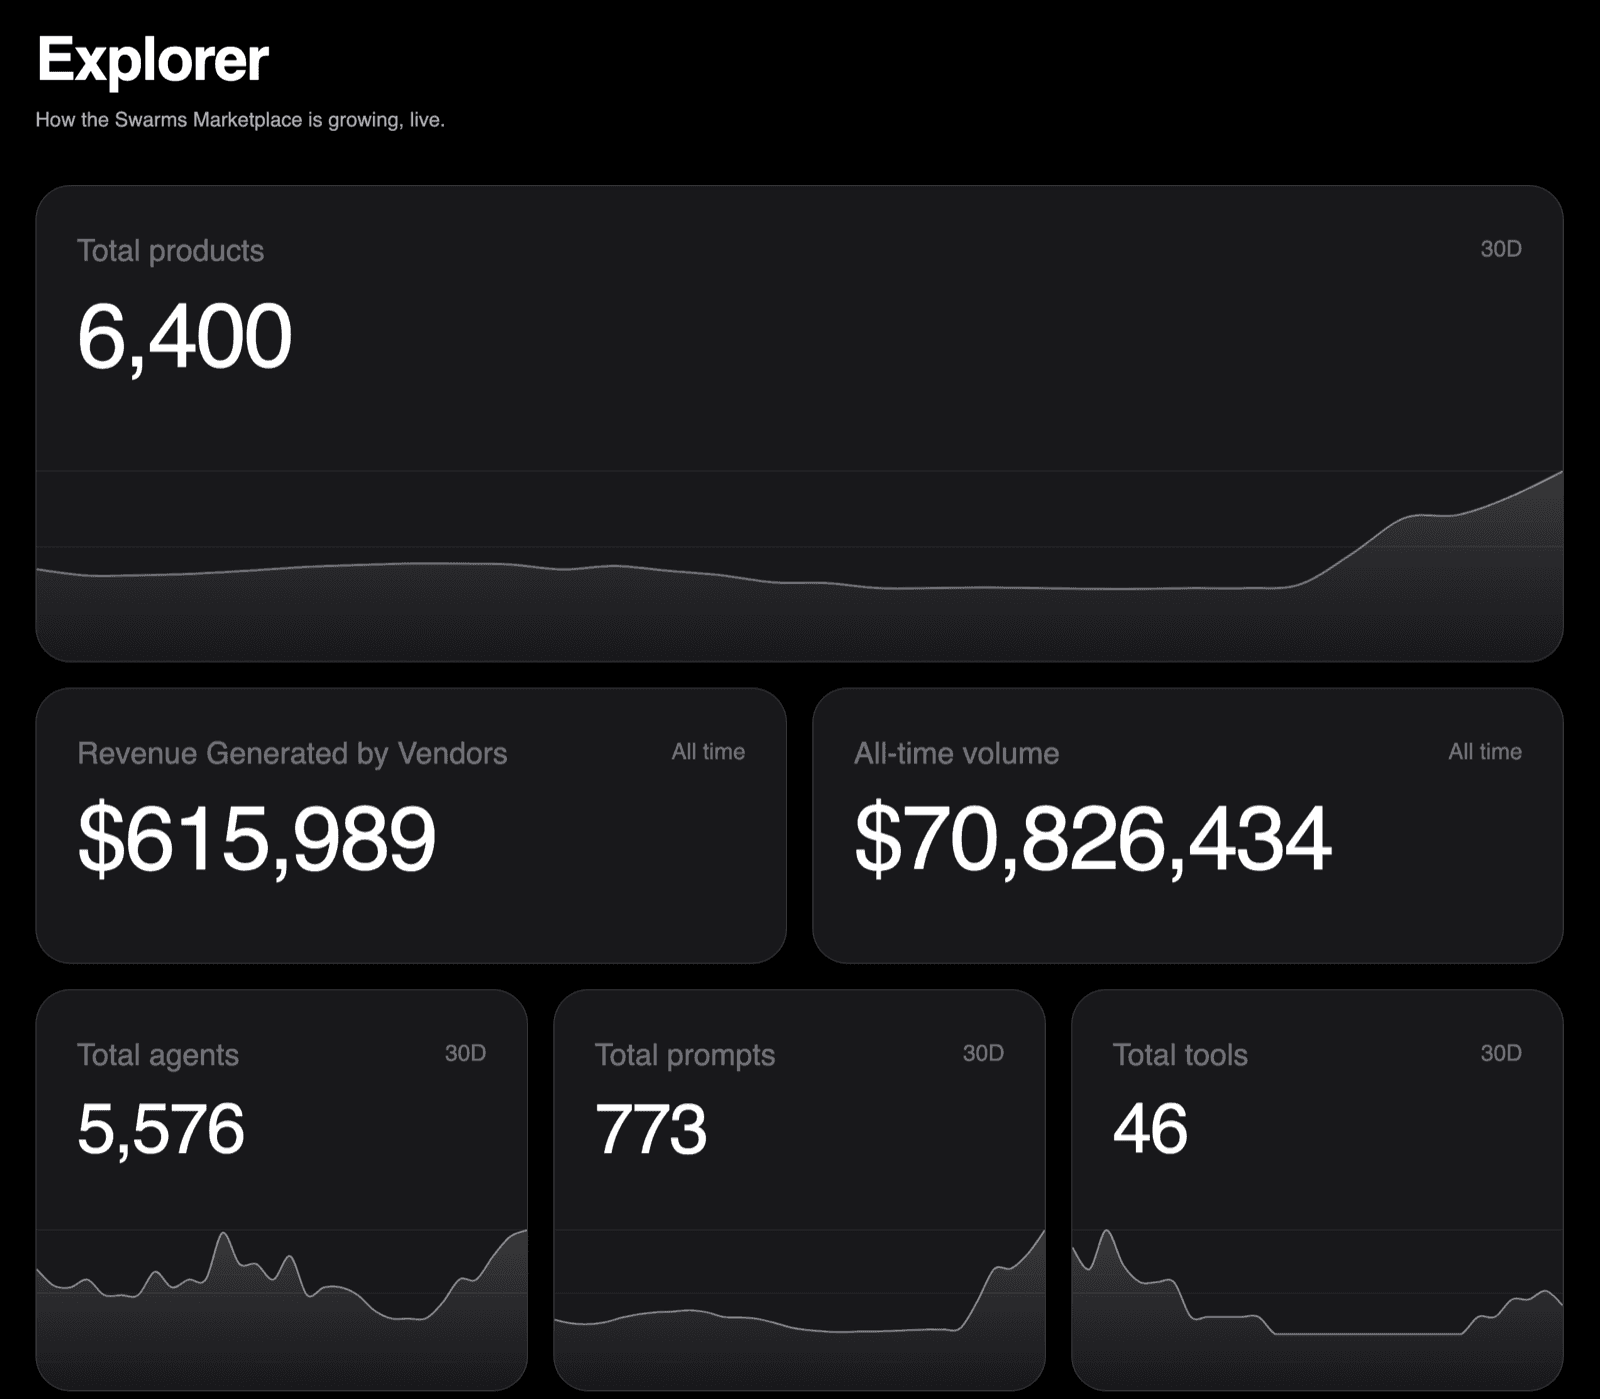
What the Explorer Shows
The Explorer is a grid of cards. Each one answers a single question about the marketplace.
| Card | What it counts |
|---|
| Total products | Every agent, prompt, tool, and bundle listed on the marketplace |
| Revenue Generated by Vendors | All-time trading fees earned by tokens launched on the marketplace, creators' and platform share combined |
| All-time volume | All-time trading volume across those same tokens |
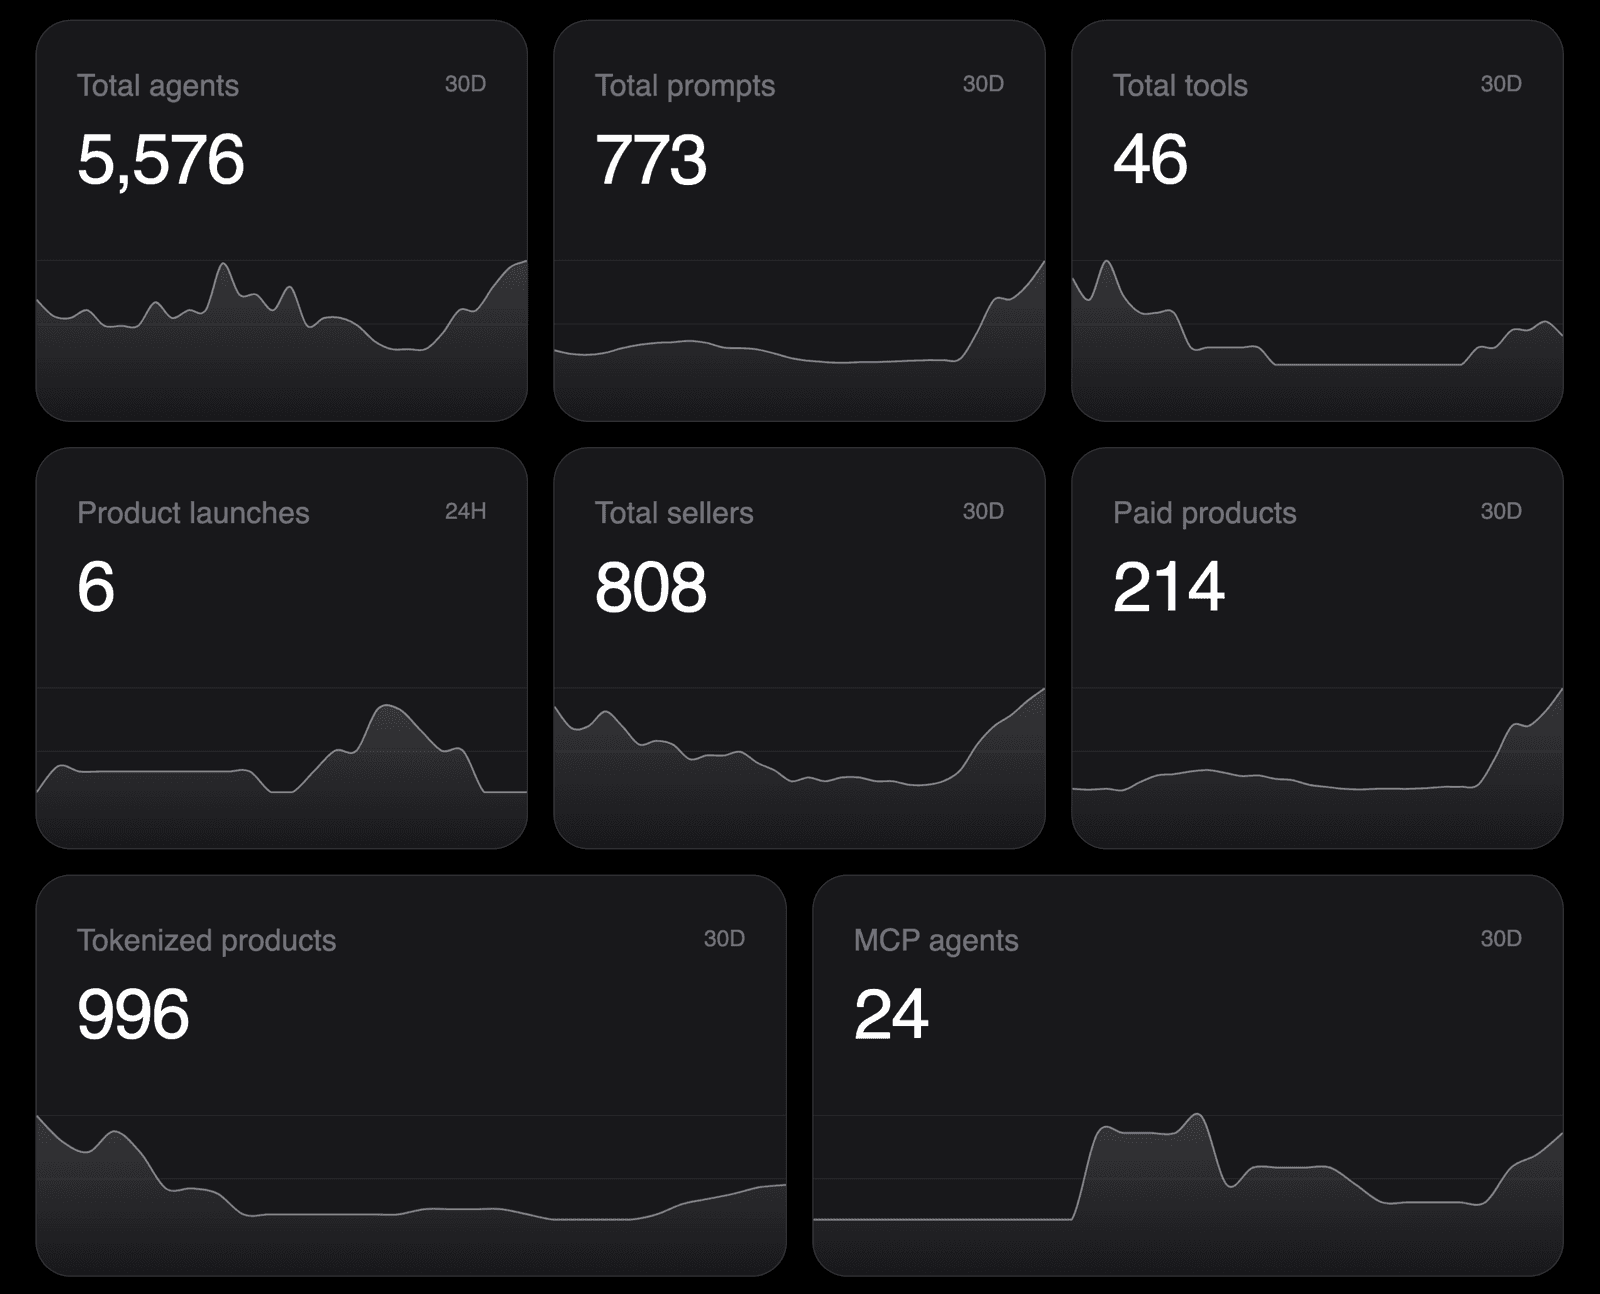
| Total agents, prompts, tools | Each product type on its own |
| Product launches | New products of every type published in the last 24 hours |
| Total sellers | Accounts that have published at least one product |
| Paid products | Listings with a price, bought by card, SOL, or USDC |
| Tokenized products | Agents and prompts with their own token |
| MCP agents | Agents that expose an MCP server |
At the time of writing, the marketplace lists 6,400 products from 808 sellers: 5,576 agents, 773 prompts, and 46 tools. 214 products are paid, 996 are tokenized, and 24 agents serve an MCP server.
Every count card also carries a small chart. For most cards it shows how many were added on each of the last 30 days, so you can see whether a number is climbing steadily or jumped in a single week. The launches card charts the last 24 hours by hour.
It Updates While You Watch
Most dashboards show a snapshot that is already out of date when you open it. The Explorer refreshes every five seconds while the tab is visible, and each digit rolls to its new value when a number changes.
- Listing counts update within 30 seconds of a new product being published.
- Revenue and volume are read directly from Solana on every refresh, so a trade on any marketplace token shows up on the page within seconds.
- Hidden tabs pause, so the page only does work when someone is looking at it.
The page is public. You do not need an account to open it, and you can share the link with anyone.
How Builders Can Use It
See where the gaps are
The product breakdown makes it obvious where supply is thin. Agents outnumber tools by more than a hundred to one, and only 24 agents expose an MCP server today. If you have built a useful tool or an MCP server, there is very little competition for attention in those categories right now. The MCP portal is a good place to start.
Check momentum before you launch
The 30-day charts and the 24-hour launches card tell you how active the marketplace is at the moment you are deciding to publish. A rising sellers line means more builders are arriving. A spike in launches means more listings competing for the front page that day.
Decide how to price
Paid and tokenized counts sit side by side, so you can see how other builders are choosing to earn. Paid listings earn on each sale, by card or crypto (see how to sell agents and prompts). Tokenized listings earn a share of every trade on their token (see how tokenized agents earn ongoing revenue).
Follow the token economy
Revenue Generated by Vendors and All-time volume show that marketplace tokens are actively traded and that the fees from those trades are real income. Every trade on a marketplace token pays a fee, and creators earn a share of it with no extra work after launch. These two cards are the running total of that activity across every token launched on the marketplace.
Share the numbers
If you are pitching your agent, writing about the agent economy, or just want to show someone what is being built on Swarms, the Explorer is a single link with the current numbers on it.
Where the Numbers Come From
We want every number on the page to be traceable, so here is exactly how each one is calculated.
- Products, agents, prompts, tools, and launches are counted straight from the marketplace's listings. Nothing is sampled or estimated.
- Sellers are accounts with at least one published product, counted from the date of their first listing.
- Paid products have a price and no token. Tokenized products have a token. These are the same rules the marketplace's pricing filter uses.
- MCP agents are agents tagged with the MCP category, which every agent with an MCP server URL receives when it is published.
- Revenue Generated by Vendors is read from each token's pool on Solana: its bonding curve on Meteora, plus the pool it moved into if it graduated. It covers tokens launched through Jupiter Studio as well as those launched on Meteora directly (more on that move here). It includes the creator's and the platform's share of trading fees, claimed or not, and leaves out Meteora's protocol fee.
- All-time volume is worked out from those fees. Every pool records the fees it has collected and charges a fixed rate per trade, 1% or 2% depending on the pool, so the fees divided by that pool's rate give the amount traded. Trades in a token's first minutes can pay a higher anti-sniping fee, so this is a close estimate.
- Dollar values: USDC counts as $1 and $SWARMS uses its live price. SOL is converted at a fixed reference price rather than the live market price, so these two cards follow trading activity and stay steady when SOL's price moves.
How to Open It
- Go to swarms.world/explorer, or click the chart icon in the marketplace sidebar, just below Leaderboard.
- Click any card to go deeper. Agents, prompts, and tools open the registry filtered to that type, Paid products opens paid listings, Tokenized products opens the Agent Token Screener, MCP agents opens the MCP servers page, and Total sellers opens the leaderboard.
Frequently Asked Questions
Do I need an account to see the Explorer?
No. The page is public and works signed out.
How often do the numbers update?
Every five seconds while the page is open. New listings appear in the counts within 30 seconds of being published.
Does revenue include tokens launched before the move to Meteora?
Yes. Revenue and volume cover every token launched on the marketplace, whether it went through Jupiter Studio or launched on Meteora directly.
What does the 30D label mean?
The chart on that card shows how many were added on each of the last 30 days. The big number is always the all-time total.
Why are there so few tools and MCP agents?
They are still a small share of what is listed, and that is exactly why they are worth building now. Fewer listings means more visibility for each one.