If your Python app feels slow to start, slow on the first request, or busy on the CPU while it streams, and it calls models through LiteLLM, the gateway is a likely place to look. LiteLLM slowdowns show up in four places: the time it takes to import litellm, the work it does on every call, the CPU it spends on each streamed chunk, and the memory a process holds. This guide measures each one, explains where the time goes, shows how to check your own app, and lists the fixes LiteLLM documents. It ends with the cases where a different gateway, such as RouteHub, is the more direct fix, and the cases where LiteLLM is still the better choice.
The numbers come from two sources, and each table says which. Most are from our technical report, RouteHub: A Low-Overhead, SDK-Native LLM Gateway for Agentic Workloads, which benchmarked LiteLLM 1.104.0 with every library in its own environment against an instant mock server. A few are fresh measurements we took for this post on LiteLLM 1.104.2, and we describe the machine and method next to them.
Signs That LiteLLM Is Slowing Down Your App
People usually notice LiteLLM latency in one of these ways:
- Slow startup. A script, CLI command or test run pauses for a second or more before anything happens, even when it never calls a model.
- Slow serverless cold starts. A Lambda, Cloud Run or similar function takes noticeably longer on its first invocation, and the extra time is the same whether the model is fast or slow.
- A slow first call. The first request in a new process takes much longer than later ones.
- CPU-heavy streaming. A server that holds many open streams uses more CPU than the token rate would suggest.
- Extra time on every call. Each request carries a small, steady cost on top of the provider's own latency, which adds up across a long agent run.
- High memory per worker. Each process holds a few hundred megabytes before it does any real work, which limits how many workers fit on a machine.
None of these change how long the model takes to answer. They are costs paid in your own process, so you can measure them and reduce them.
Why Is LiteLLM Slow to Import?
Importing LiteLLM loads a lot of code. In the paper's benchmark, import litellm (version 1.104.0) took a median of 1,235 ms over 20 fresh processes and added 2,502 modules to sys.modules, including about 1,040 of LiteLLM's own, the OpenAI SDK, requests, aiohttp, jinja2, yaml and tokenizers. The process held 194 MiB before it sent a single request. For comparison, the bare OpenAI SDK imported in 217 ms with 782 modules.
We repeated the import measurement for this post on the current release:
| Configuration | Median import time | Modules added |
|---|
| LiteLLM 1.104.2, default settings | 1,295 ms | 2,585 |
LiteLLM 1.104.2, LITELLM_LOCAL_MODEL_COST_MAP=True | 1,101 ms | 2,523 |
| RouteHub 0.2.0 | 3.2 ms | 18 |
Our measurement: Apple M3 Pro, macOS 15.7, Python 3.12.3, one uv environment with litellm 1.104.2, routehub 0.2.0 and openai 2.54.0. Two warm-up runs, then 9 fresh processes per configuration, interleaved, with only PATH, HOME and LANG set.
Running python -X importtime -c "import litellm" on the same setup, with the bundled price map, showed where the time goes: LiteLLM's own 1,104 modules accounted for about 61% of the import's self time, and third-party packages such as the OpenAI SDK (about 218 ms including its dependencies) and aiohttp (about 60 ms) made up most of the rest. In other words, the import is slow mainly because LiteLLM loads its provider integrations, types and utilities up front, whether or not your code uses them.
The model price map download
LiteLLM keeps a map of model prices, context windows and capabilities. By default it fetches the latest copy from GitHub while it is being imported, with a 5 second timeout, and falls back to a copy bundled with the package if the fetch fails. That network request sits inside your import statement. In the paper it added a median of 145 ms on the authors' connection, and in our run above the difference between the two configurations was 194 ms. On a slow or restricted network the cost can be larger, and startup then depends on GitHub being reachable.
LiteLLM documents an environment variable that turns this off: set LITELLM_LOCAL_MODEL_COST_MAP=True and it uses the bundled map instead. The trade-off, as the docs note, is that you only get new prices and models when you upgrade LiteLLM.
Why Is LiteLLM Slow on Every Call?
Once a process is warm, LiteLLM still does extra work around each request. The paper measured the median latency of 1,200 sequential calls against an instant mock server, which isolates client-side work:
| Added latency over the bare provider SDK | 1-message request | 22-message agent request |
|---|
| LiteLLM 1.104.0, OpenAI route | +647 µs | +736 µs |
| LiteLLM 1.104.0, Anthropic route | +567 µs | +669 µs |
| RouteHub, OpenAI route | +9 µs | +32 µs |
| RouteHub, Anthropic route | -159 µs | -161 µs |
Source: the RouteHub technical report. The bare OpenAI SDK took 0.54 ms for a 1-message call on this setup. Negative numbers mean faster than the official SDK.
The paper traced LiteLLM's extra time to work it does on every call: it creates a logging object, runs cache and response-metadata hooks, converts the reply into its own response type, and submits a success handler to a background thread pool. Under cProfile, a 1-message request through LiteLLM executed 10,576 Python function calls, against 5,961 for the bare OpenAI SDK, and 26.7% of the profiled time was in LiteLLM's own package.
We also profiled LiteLLM 1.104.2 with its documented mock_response option, which skips the network and the provider SDK entirely, so everything left is LiteLLM's own work. On the machine above, a call took a median of 0.51 ms and about 5,300 function calls. The largest entries in the profile were parameter mapping (get_optional_params), response metadata, model information lookups and the per-call cost calculation.
Half a millisecond does not matter for one chat message, which takes seconds to generate. It matters when it is multiplied: an agent that makes hundreds of calls, a service that pushes thousands of requests per second through one process, or a test suite that runs every call against a mock.
Why Does LiteLLM Streaming Use So Much CPU?
Streaming multiplies per-event work by the number of chunks. The paper timed 200-chunk streams from an instant mock server:
| 200-chunk stream | First chunk | Full stream | Per chunk |
|---|
| LiteLLM 1.104.0, OpenAI route | 16.61 ms | 61.1 ms | 224 µs |
| LiteLLM 1.104.0, Anthropic route | 14.69 ms | 66.6 ms | 261 µs |
| Bare OpenAI SDK | 1.00 ms | 9.8 ms | 44 µs |
| Bare Anthropic SDK | 0.41 ms | 2.4 ms | 10 µs |
| RouteHub, Anthropic route | 0.29 ms | 1.2 ms | 5 µs |
At 100 chunks per second, a cost of about 0.2 ms per chunk uses 2% of a CPU core for each open stream. A process serving 50 concurrent streams would spend about a full core on chunk handling alone. If your streaming servers run hot, this is a likely reason.
Why Do Agent Steps Reconnect After a Tool Call?
Agents often pause between model calls while a tool runs. Reusing an open HTTP connection after that pause saves a TCP and TLS handshake. httpx, which the OpenAI SDK uses, closes idle pooled connections after 5 seconds by default, and LiteLLM's sync OpenAI route builds a plain httpx.Client with those defaults.
The paper tested this over a real network, against api.openai.com with a deliberately invalid key so that no model time was involved. After a 10 second pause, LiteLLM's next request took 185 ms and the bare OpenAI SDK's took 166 ms, because both had to reconnect. RouteHub, which keeps connections for 60 seconds, reused its connection and answered in 116 ms. That is about 67 ms per agent step whose tool call runs longer than five seconds, or about 3.3 seconds of connection setup over a 50-step run. This one is not specific to LiteLLM: it comes from HTTP client defaults that suit browsers more than agents.
How Much Memory Does LiteLLM Use?
In the paper, peak memory after the first request was 211 MiB for LiteLLM, 3.9 times RouteHub's 54 MiB and the bare OpenAI SDK's 53 MiB. LiteLLM also installs 58 packages (168.5 MiB on disk), against 21 for RouteHub. If you run many worker processes on one machine, this sets how many fit.
How to Measure LiteLLM Latency in Your Own App
Before you change anything, measure. These checks take a few minutes and work on any machine.
Import time. Python's built-in -X importtime flag prints how long each module takes to import:
python -X importtime -c "import litellm" 2> importtime.txt
sort -t '|' -k2 -n importtime.txt | tail -20
For a simple wall-clock number, time the import in a few fresh processes, with and without the price map download:
for i in 1 2 3 4 5; do
  python -c "import time; t = time.perf_counter(); import litellm; print(f'{(time.perf_counter() - t) * 1000:.0f} ms')"
done

for i in 1 2 3 4 5; do
  LITELLM_LOCAL_MODEL_COST_MAP=True python -c "import time; t = time.perf_counter(); import litellm; print(f'{(time.perf_counter() - t) * 1000:.0f} ms')"
done
Per-call overhead. mock_response returns a response without calling the provider, so timing it shows LiteLLM's own work per call:
import os
os.environ.setdefault("LITELLM_LOCAL_MODEL_COST_MAP", "True")

import statistics
import time

import litellm

messages = [{"role": "user", "content": "Say hi"}]

def call():
    return litellm.completion(model="gpt-5.4-mini", messages=messages, mock_response="hi")

for _ in range(50):  # warm up
    call()

samples = []
for _ in range(500):
    start = time.perf_counter()
    call()
    samples.append((time.perf_counter() - start) * 1000)

print(f"median {statistics.median(samples):.3f} ms per call")
Where the time goes. cProfile counts every function call, which is steadier than wall-clock time:
import cProfile
import pstats

import litellm

messages = [{"role": "user", "content": "Say hi"}]
litellm.completion(model="gpt-5.4-mini", messages=messages, mock_response="hi")

with cProfile.Profile() as profiler:
    for _ in range(200):
        litellm.completion(model="gpt-5.4-mini", messages=messages, mock_response="hi")

stats = pstats.Stats(profiler)
print(f"{stats.total_calls / 200:.0f} function calls per request")
stats.sort_stats("cumulative").print_stats(15)
Run the same scripts with your real model and network to see how much of your end-to-end latency LiteLLM accounts for. If it is a small share, the fixes below may be all you need.
How to Speed Up LiteLLM
These changes work inside LiteLLM and are documented by the LiteLLM project or by Python itself.
1. Use the bundled price map. Set LITELLM_LOCAL_MODEL_COST_MAP=True in the environment before LiteLLM is imported. This removes the network request from import litellm and the dependency on GitHub at startup. In our measurement it saved 194 ms. Remember to upgrade LiteLLM to pick up new models and prices.
2. Keep debug logging off in production. LiteLLM's latency troubleshooting guide names DEBUG logging as the top cause of latency with large payloads and recommends LITELLM_LOG=INFO. If you turned on debug output while developing, make sure it is off where performance matters.
3. Pay the import once per process. If your app imports LiteLLM at the top of a module that every command or test loads, move the import inside the function that sends requests. Python then imports LiteLLM only when that function first runs, so commands and tests that never call a model skip the cost. This defers the cost; it does not remove it. For servers, run long-lived workers so the import happens once at startup rather than once per request.
4. Reuse HTTP sessions for async calls. LiteLLM supports passing a shared_session (an aiohttp.ClientSession) to acompletion(), so many calls reuse the same connections instead of opening new ones. Create the session once at startup and close it on shutdown.
5. Use the async API for high concurrency. LiteLLM's async calls use an aiohttp transport by default (see disable_aiohttp_transport in LiteLLM's settings). In the paper's throughput test, LiteLLM's throughput stayed flat as concurrency rose, and at 128 requests in flight it served more requests per second than RouteHub and the bare OpenAI SDK on the OpenAI route. If you fan out to many requests from one process, acompletion() with a shared session is LiteLLM's strongest configuration.
When LiteLLM Fixes Stop Helping
The fixes above remove the network request at import and avoid paying for things you don't use. They do not change how much code LiteLLM loads or how much work it does per call:
- Import stays above a second. With the bundled price map, our import still took 1,101 ms and loaded 2,523 modules. Deferring the import moves that second to the first request, which is still a cold start in serverless functions and short-lived workers.
- Per-call work stays. The logging object, hooks, metadata, cost calculation and response conversion run on every call. LiteLLM's logging settings control what gets recorded, and this code path runs either way.
- Streaming cost stays. Each chunk still goes through LiteLLM's own chunk handling.
- Memory stays. The modules that are loaded stay in memory.
If those costs show up in your measurements, the next step is a gateway with a smaller hot path.
Switching to RouteHub as the Structural Fix
RouteHub is an open-source gateway with LiteLLM's function names and module paths, so most code only needs a new import. It loads nothing until a request needs it, makes no network calls during import, returns the OpenAI SDK's own response objects, keeps clients and connections alive across agent steps, and calls Anthropic's native Messages API directly. You can read how each of those works in our launch post.
From the paper, against LiteLLM 1.104.0:
| LiteLLM | RouteHub |
|---|
| Import | 1,235 ms | 3.2 ms (383x faster) |
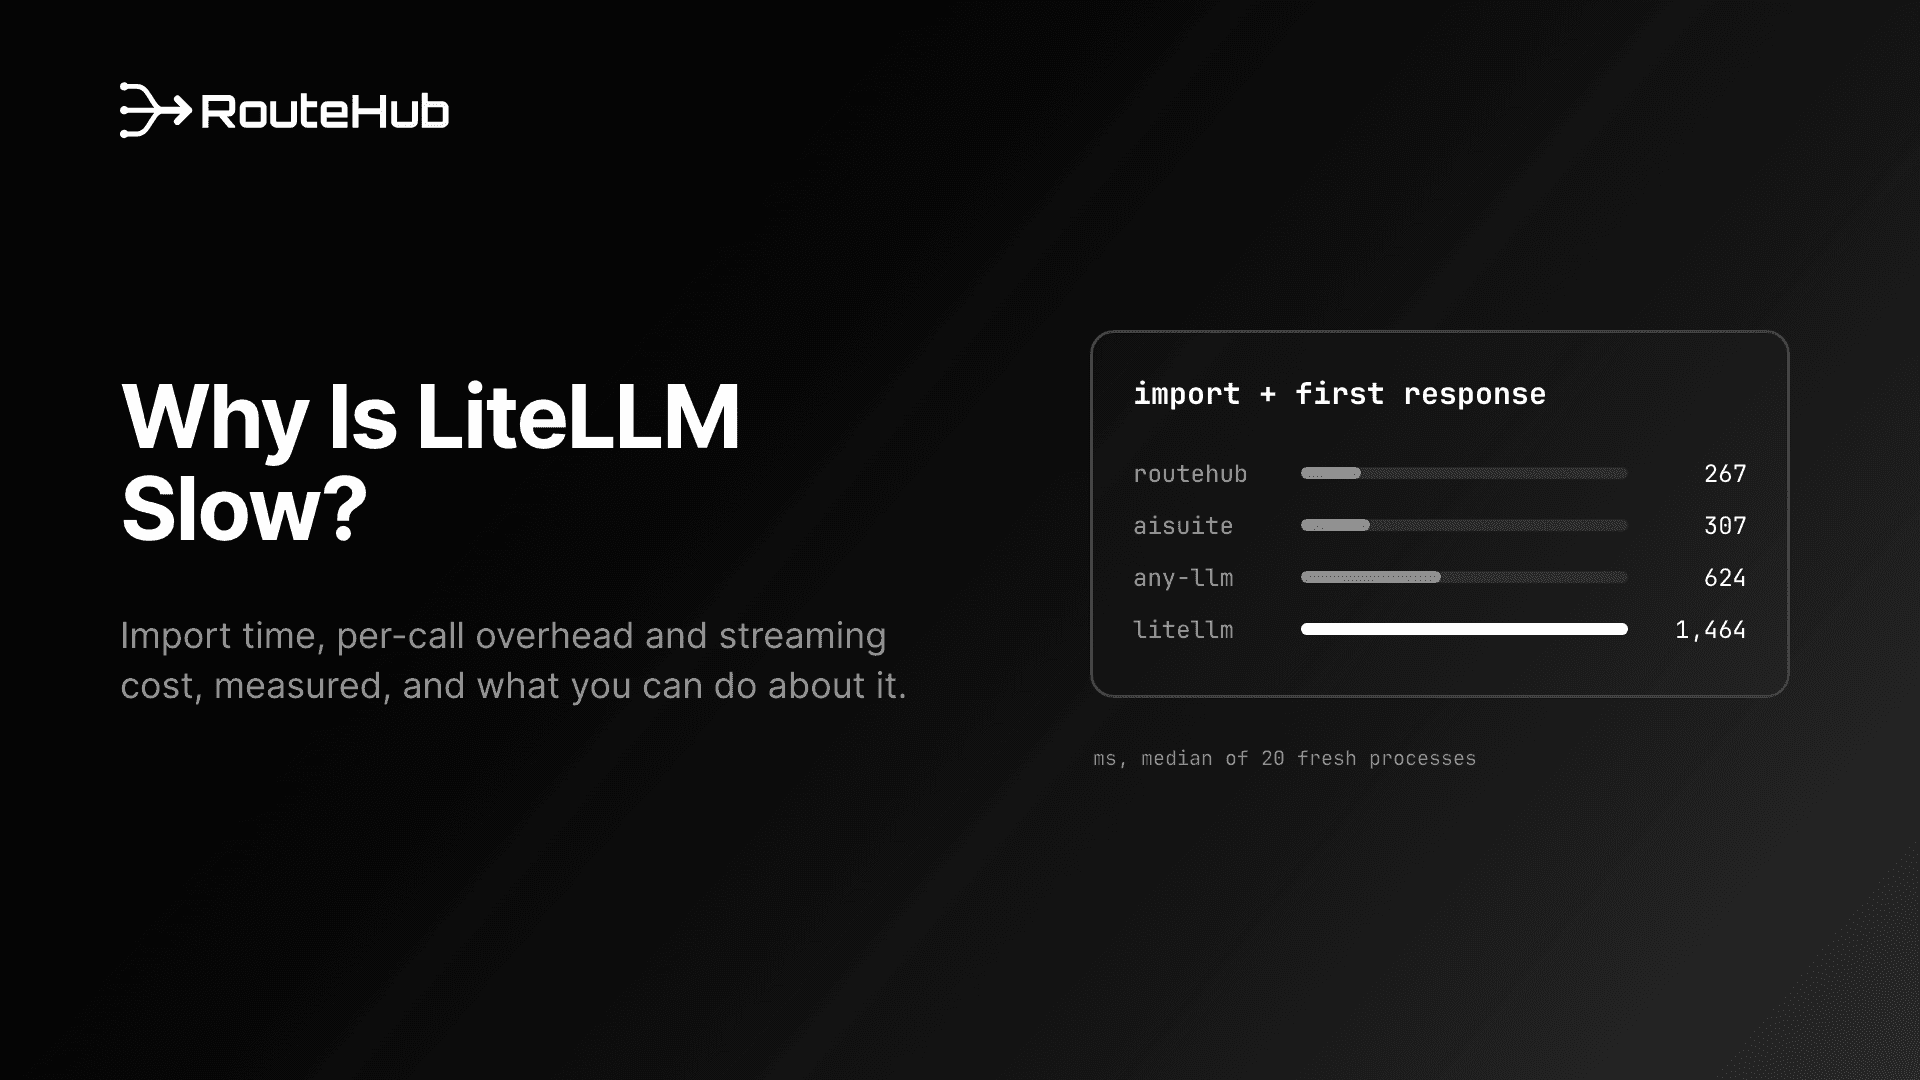
| Import + first response | 1,464 ms | 267 ms (5.5x faster) |
| Peak memory after first request | 211 MiB | 54 MiB (3.9x less) |
| Added latency per call, OpenAI route | +647 µs | +9 µs |
| Python function calls per request | 10,576 | 6,031 |
| Per streamed chunk, Anthropic route | 261 µs | 5 µs |
| Next request after a 10 s pause (real network) | 185 ms | 116 ms |
| Packages installed | 58 | 21 |
Switching usually looks like this:
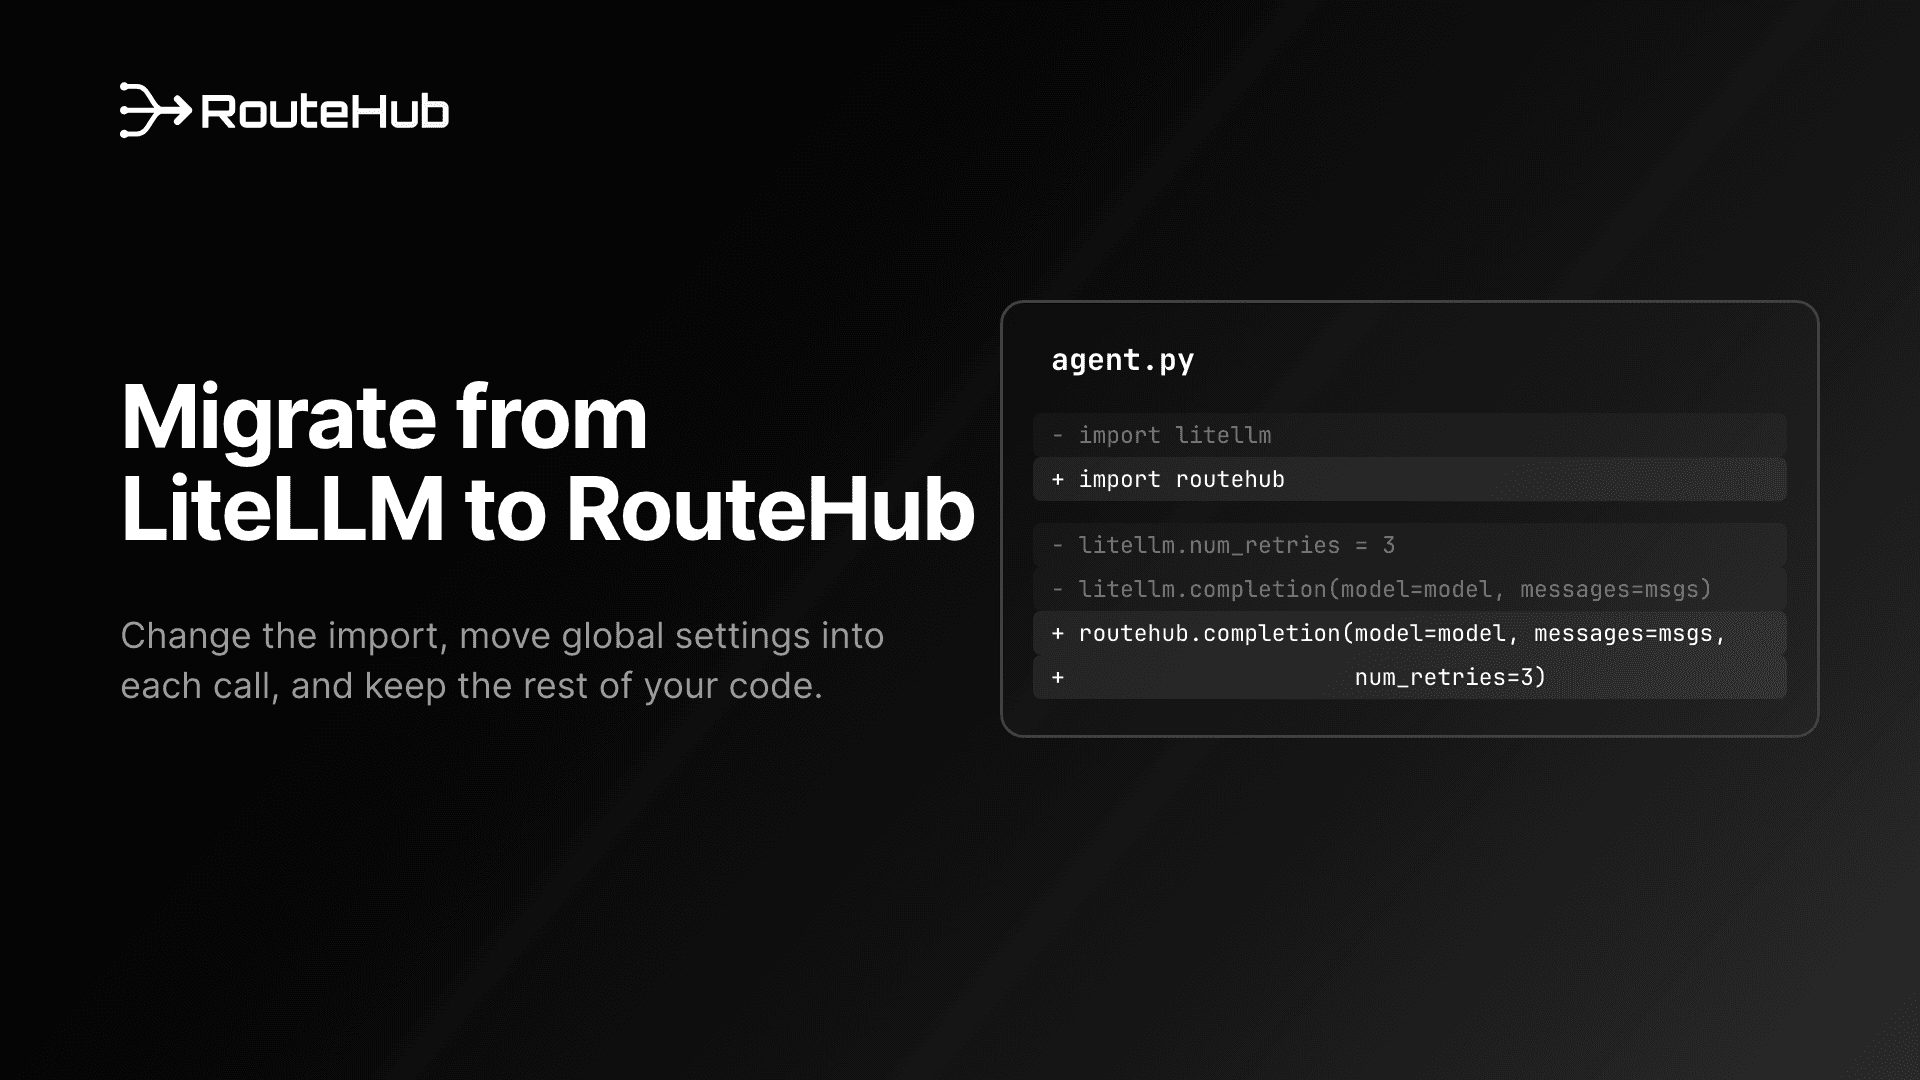
# Before
from litellm import completion

# After
from routehub import completion

response = completion(
    model="claude-sonnet-4-6",
    messages=[{"role": "user", "content": "Summarize our Q3 risks in three bullets."}],
    num_retries=3,
)
print(response.choices[0].message.content)
Two things to plan for: RouteHub's settings are arguments to each call rather than module globals (litellm.num_retries = 3 becomes completion(..., num_retries=3)), and responses are OpenAI SDK objects, so you read them with attributes rather than dictionary keys. Our migration guide covers the details. Install it from PyPI with pip install routehub or uv add routehub.
Where LiteLLM Is Still the Better Choice
LiteLLM is the right tool in several situations, and the benchmark shows one where it is faster:
- Very high async concurrency. At 128 requests in flight from one process, LiteLLM's aiohttp transport served 876 requests per second on the OpenAI route against RouteHub's 711, and 942 against 865 on the Anthropic route (RouteHub with its optional orjson extra reached 1,048 there). At that level the limit was the httpx library that RouteHub and the bare SDKs share. Exposing an aiohttp transport in RouteHub is on its roadmap.
- Features beyond the client. LiteLLM includes a proxy server, budgets, spend logging, caching, callbacks, routing and fallbacks across more than 100 providers. RouteHub covers more than 20 providers and leaves those features to your application or a separate service.
- A single interactive call. For one request at a time in a long-running process, LiteLLM's overhead is under a millisecond against seconds of model time, and the fixes above may be enough.
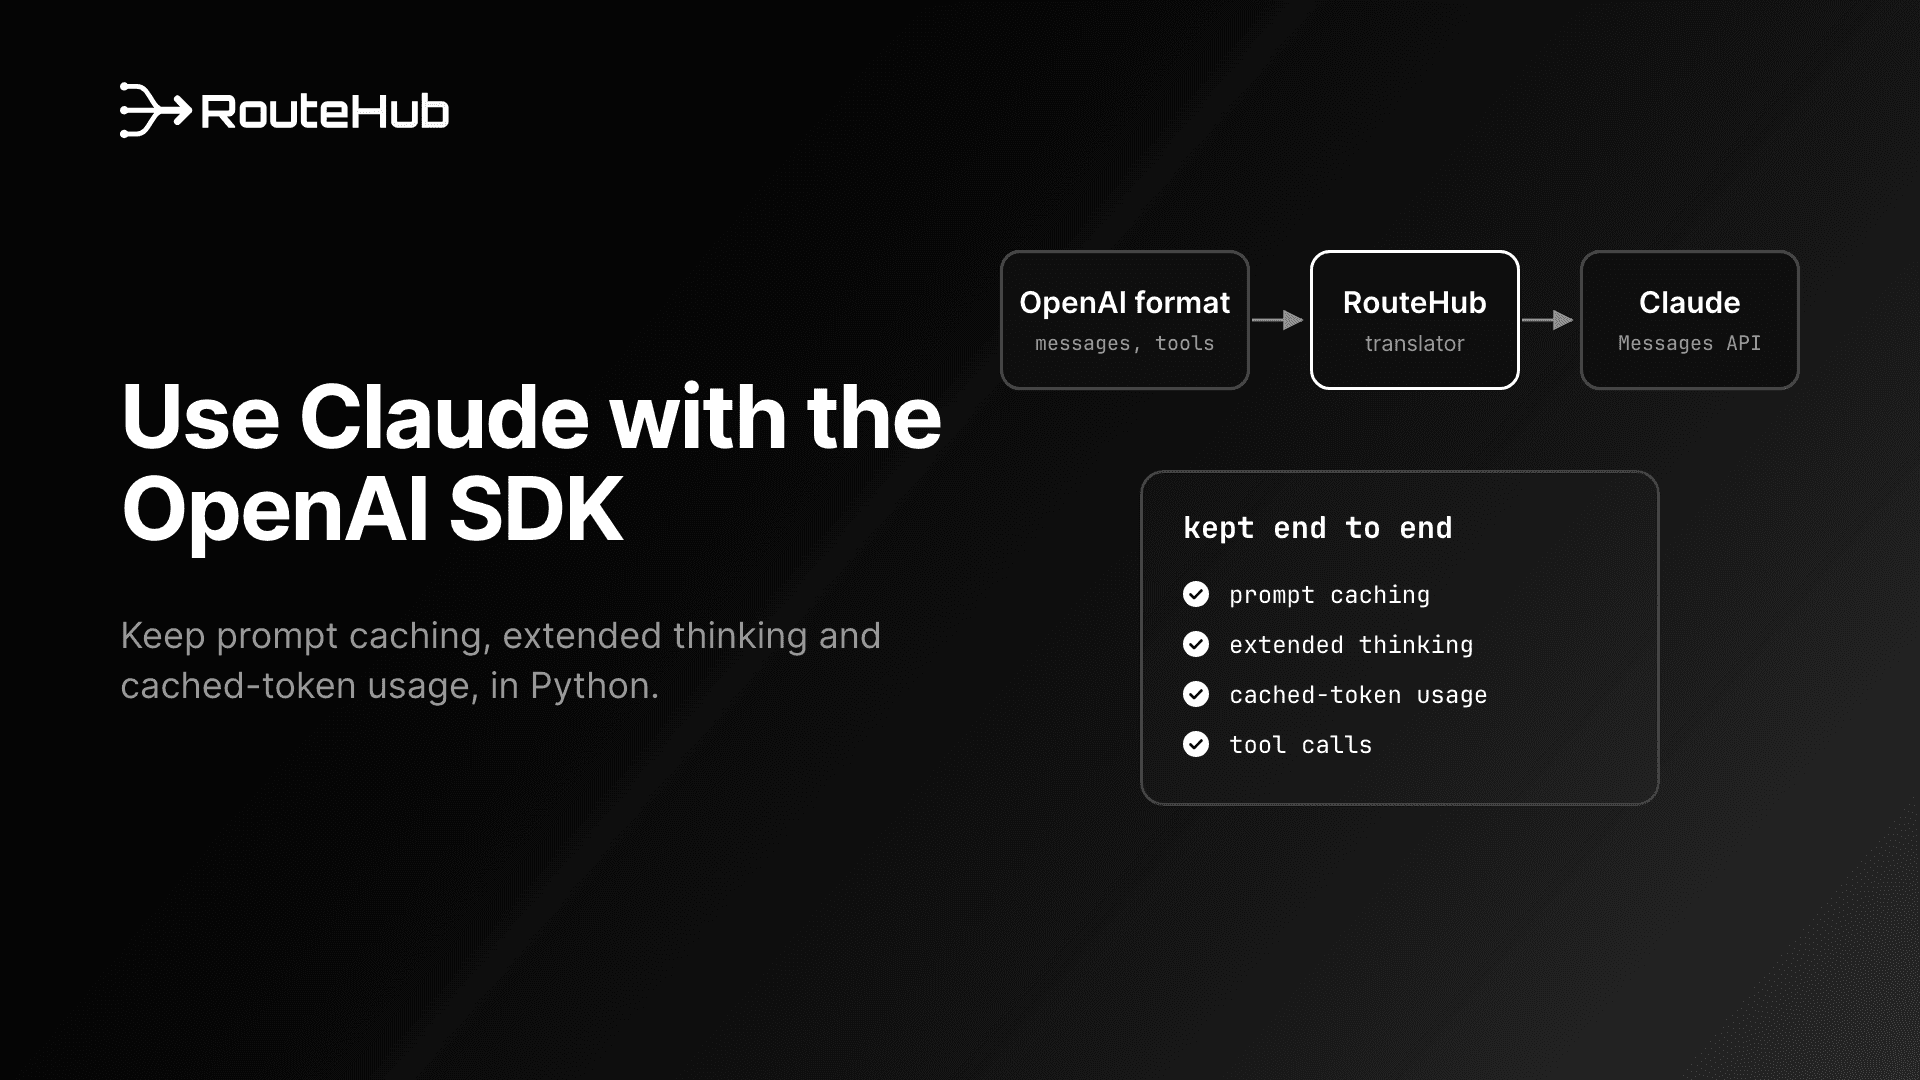
For a side-by-side look at the options, see the best LLM gateway for Python and the best LiteLLM alternative. If you mostly call Claude, our guide to calling Claude with the OpenAI format in Python explains the native Anthropic path.
Frequently Asked Questions
Why is import litellm so slow?
It loads about 2,500 modules at import, including LiteLLM's provider integrations and the OpenAI SDK, and by default it downloads its model price map from GitHub. The paper measured 1,235 ms for LiteLLM 1.104.0, and we measured 1,295 ms for 1.104.2.
What does LITELLM_LOCAL_MODEL_COST_MAP do?
When set to True, LiteLLM uses the price and context-window map bundled with the package instead of fetching the latest copy from GitHub during import. It removes a network request from startup. You then get new models and prices by upgrading LiteLLM.
How much latency does LiteLLM add per request?
In the paper's mock-server benchmark, LiteLLM 1.104.0 added 647 µs to a 1-message OpenAI call and 736 µs to a 22-message agent request, compared with the bare OpenAI SDK. Streaming added about 224 to 261 µs per chunk.
Does LiteLLM's overhead matter if the model takes seconds to respond?
For a single interactive request, usually not. It matters when the cost is multiplied: cold starts in serverless functions, agents that make hundreds of calls, servers with many concurrent streams, and test suites that run many mocked calls.
Is RouteHub a drop-in replacement for LiteLLM?
For most code it is a change of import, since RouteHub keeps LiteLLM's function names and module paths. Settings move from module globals to per-call arguments, and responses are OpenAI SDK objects instead of LiteLLM's own type. Proxy features such as budgets and spend logging are not part of RouteHub.
Is LiteLLM ever faster than RouteHub?
Yes. At 128 concurrent async requests from one process, LiteLLM's aiohttp transport delivered more requests per second than RouteHub's default install on both the OpenAI and Anthropic routes in the paper's benchmark. At lower concurrency, and on startup, per-call latency, streaming, memory and connection reuse, RouteHub was faster.